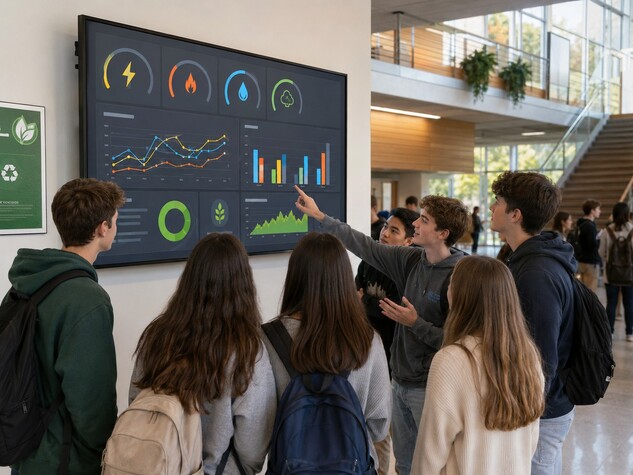
A student-led dashboard showing the school’s energy use to raise awareness, reduce waste, and support smarter energy-saving decisions.
Idea Description:
The live energy dashboard project aims to make the school’s energy consumption visible, understandable, and engaging for students, teachers, and staff. The idea is to create a digital or physical dashboard that shows how much electricity, heating energy, and water the school uses over time.
At the moment, energy consumption is usually hidden in monthly bills and is not visible to students in everyday school life. Because of this, it is difficult to understand how daily behaviour affects energy use. A live dashboard would help solve this problem by showing real data in a simple and visual way. The dashboard could display electricity use, heating consumption, water use, indoor temperature, classroom lighting conditions, and estimated CO₂ emissions. The data could be shown on a screen in the school entrance, on the school website, or as a printed weekly energy board. If live meter data is not available at the beginning, the project could start with weekly or monthly data collected from school bills and meter readings.
Students would be actively involved in collecting, analysing, and explaining the data. They could compare energy consumption between weeks, identify periods of high use, and suggest practical actions to reduce waste. For example, students could notice if electricity use stays high after school hours, if classrooms are overheated, or if lighting is used when there is enough daylight. The project would also include an awareness campaign. Students could create simple messages, posters, and challenges based on dashboard data, such as “Switch-Off Week”, “Lowest Energy Classroom”, or “Daylight First Day”. This would connect real data with everyday action. The expected results are reduced energy consumption, lower energy costs, better understanding of sustainability, and stronger student participation in school energy management. The dashboard would turn the school building into a learning tool and help students understand how energy efficiency, climate action, and responsible behaviour are connected.
This idea is realistic because it can be implemented in stages. The first stage can be a simple manual dashboard using existing energy bills and meter readings. Later, the school can add digital tools, smart meters, sensors, or automatic data visualisation. This makes the project affordable, flexible, and suitable for student-led implementation.

Most voted